
I’m extremely confident that learning how to implement volume profiles into your trading will drastically improve your performance.
I’ve trained a lot of traders over my 20 year career. A reoccurring theme with unprofitable traders is they trade setups or patterns without applying any sort of context.
I wouldn’t consider this a trading strategy, it’s simply trading a pattern.
A trading strategy should not only clearly define your edge but must also define under what context you will execute that edge.
A typical “ah ha” moment for a trader is when they learn to use volume profiles to build context around their trades.
As an order flow trader, volume profiles are at the core foundation of all my trading strategies. By the end of this guide you will have a firm understanding of how to use volume profiles.
Excited? You should be, let’s get into it.
What Is a Volume Profile
A Volume Profile is an advanced charting indicator that displays total volume traded at every price level over a user specified time period.
Volume Profiles Uses:
- Identify Key Support and Resistance Levels for Setups
- Determine Logical Take Profits and Stop Losses
- Calculate Initial R Multiplier
- Identify Balanced vs Imbalanced Markets
- Determine Strength of Trends
Let’s take a look at the basic components of a volume profile.
Volume Profile Components
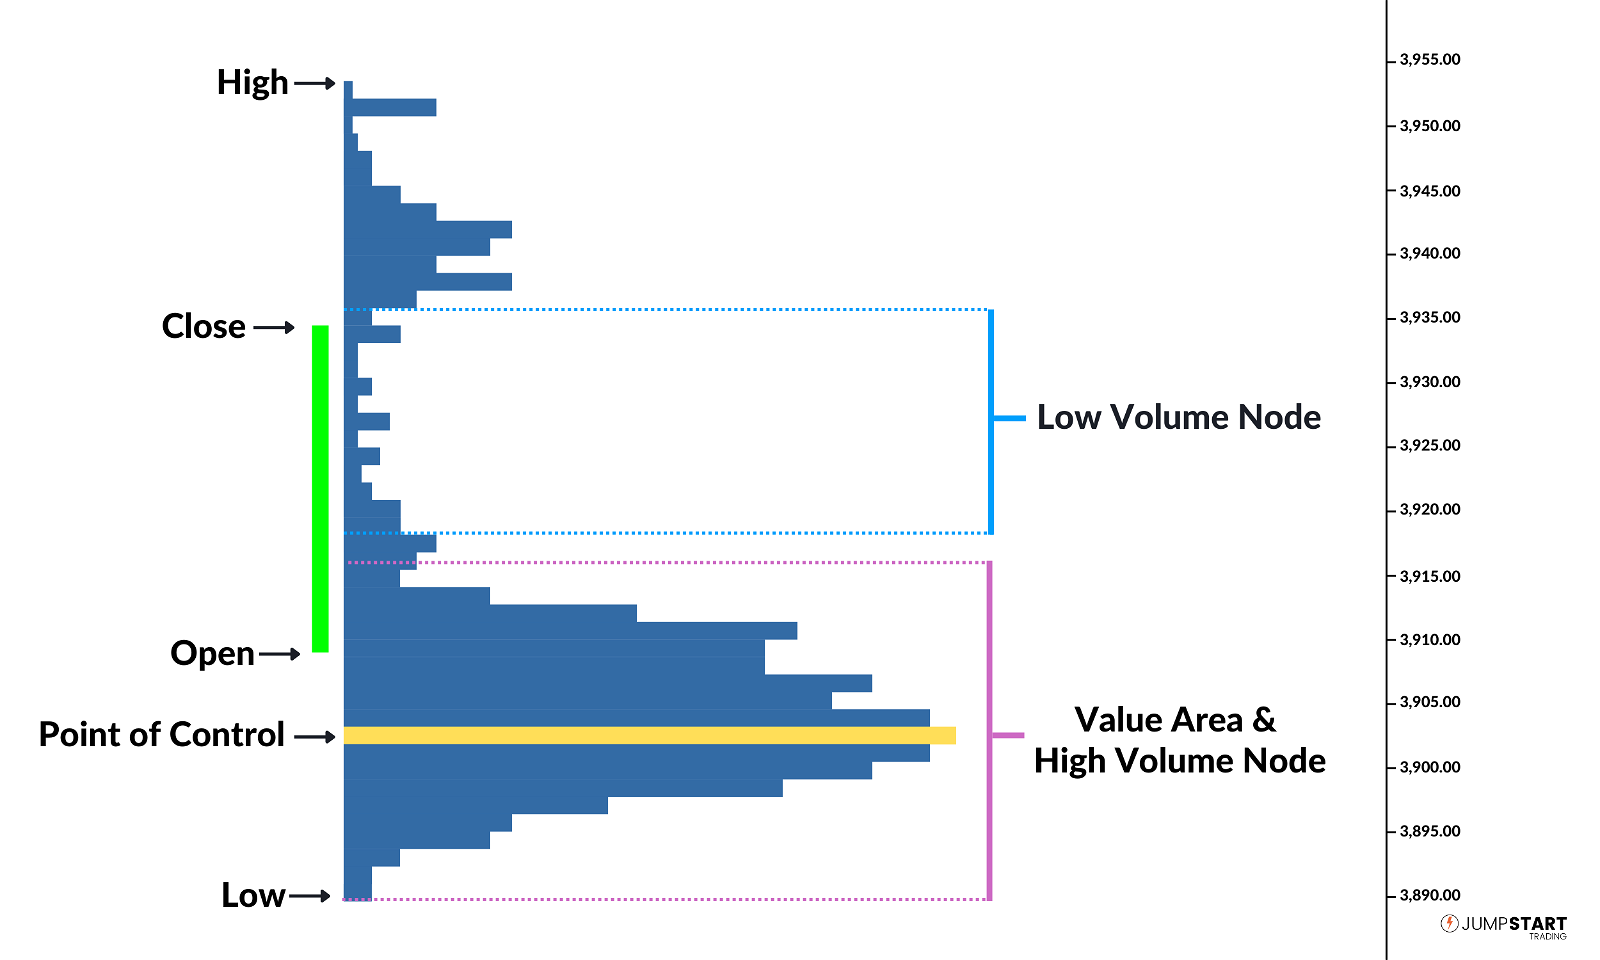
1. Open, High, Low, & Close: There’s different styles of volume profile indicators but the majority of them will designate the OHLC.
2. Point of Control (POC): Price level where the most volume traded for the session. Commonly referred to as the POC.
3. Value Area (VA): Price range in which a user specified percentage volume was traded for a session. Volume profile traditionalist use 70% as it close to 1 standard deviation from the mean. The Point of Control is used as the mean on a volume profile.
Below is a normal distribution that you might remember from statistics.
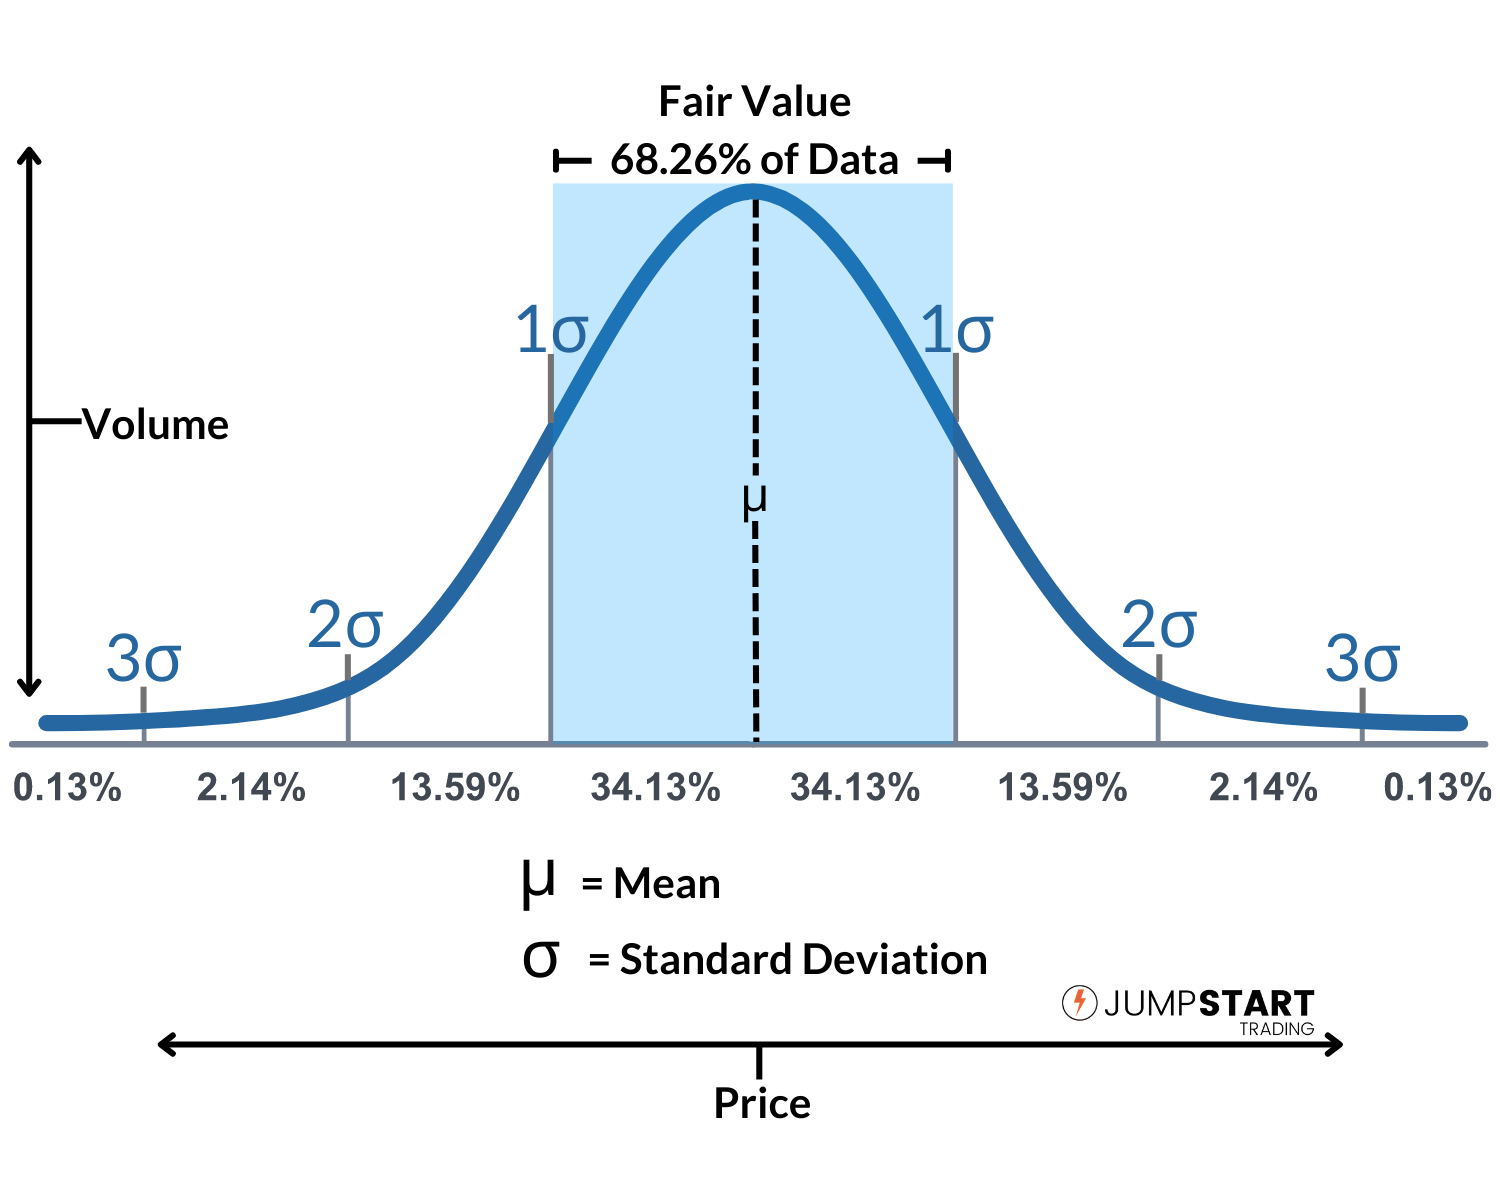
In a perfect normal distribution, which the markets never are, 68.26% of all data (in our case trades) occurs within one standard deviation of the mean (point of control). Thus the 70% used by traditionalist when determining fair value.
Prices above or below fair value are considered “unfair” prices (i.e., not accurate reflections of the traded security’s true intrinsic value).
If these concepts are new to you, make sure to read this post on Auction Market Theory.
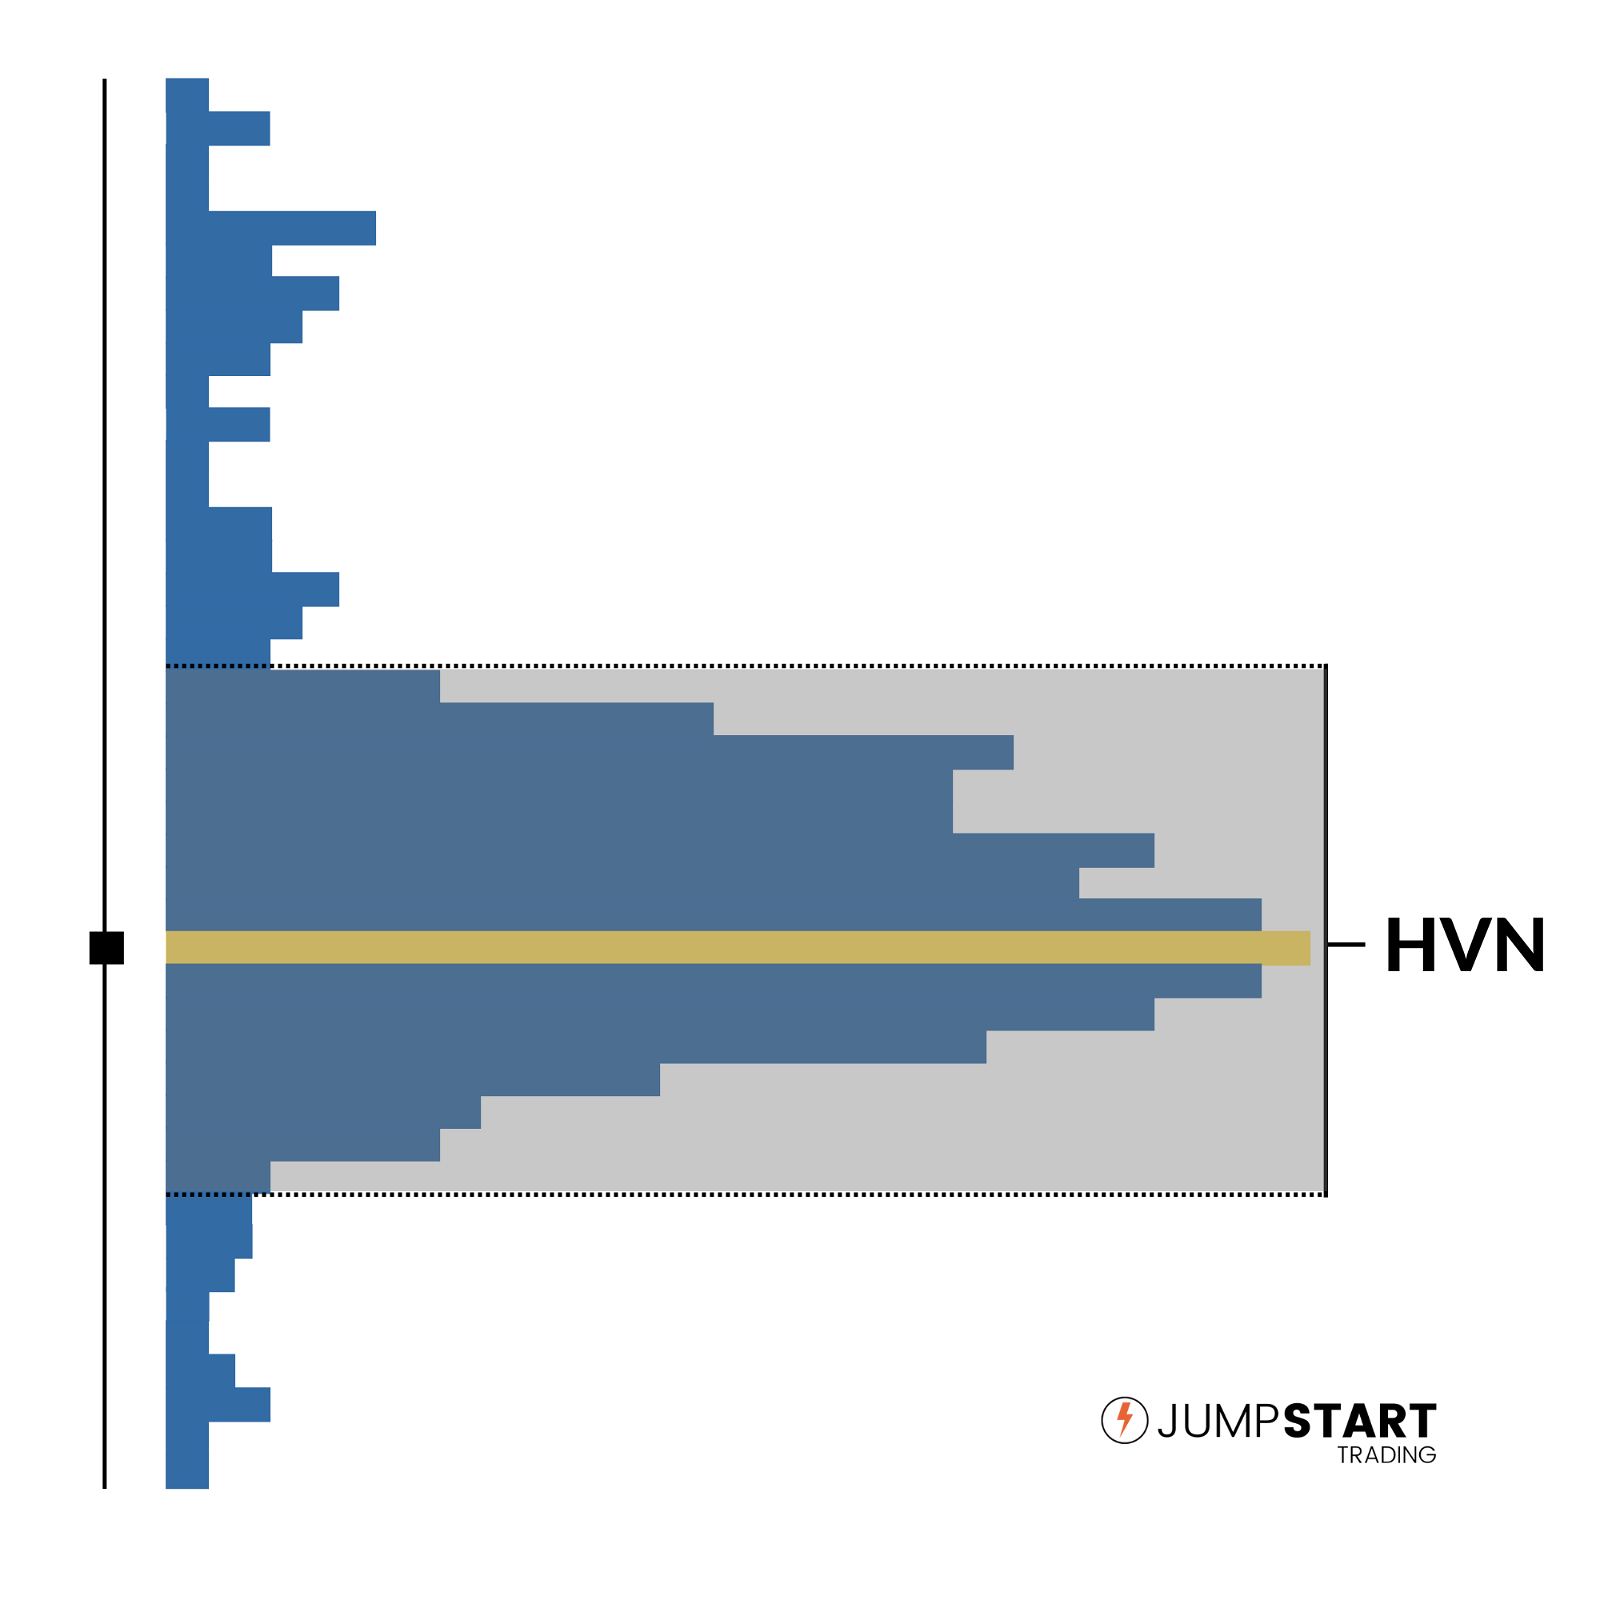
4. High Volume Node (HVN): Area of high volume relative to surrounding price action
5. Low Volume Node (LVN): Area of low volume relative to surrounding price action
Analysis of price in relation to high and low volume nodes is useful when building context around your trades.
High volume nodes act like gravity. They tend to attract price and try to hold it there.
Conversely, Low Volume Nodes are areas with low gravity. The market often bounces right over these levels, not staying for long because there’s not much gravitational pull.
This makes sense because low volume nodes are areas of low liquidity where participation is low. Where as high volume nodes represent where the most transactions took place.
Now that we’ve established the basic components of a volume profile let’s look at several types of volume profile indicators.
Volume Profile Indicators
Volume profiles can be setup in variety of variations depending on the indicator and charting software you’re using .
Let’s take a look at the different indicators and their best use.
X-axis Volume
You should be familiar with volume displayed in its tradition manner on the x-axis as seen below.
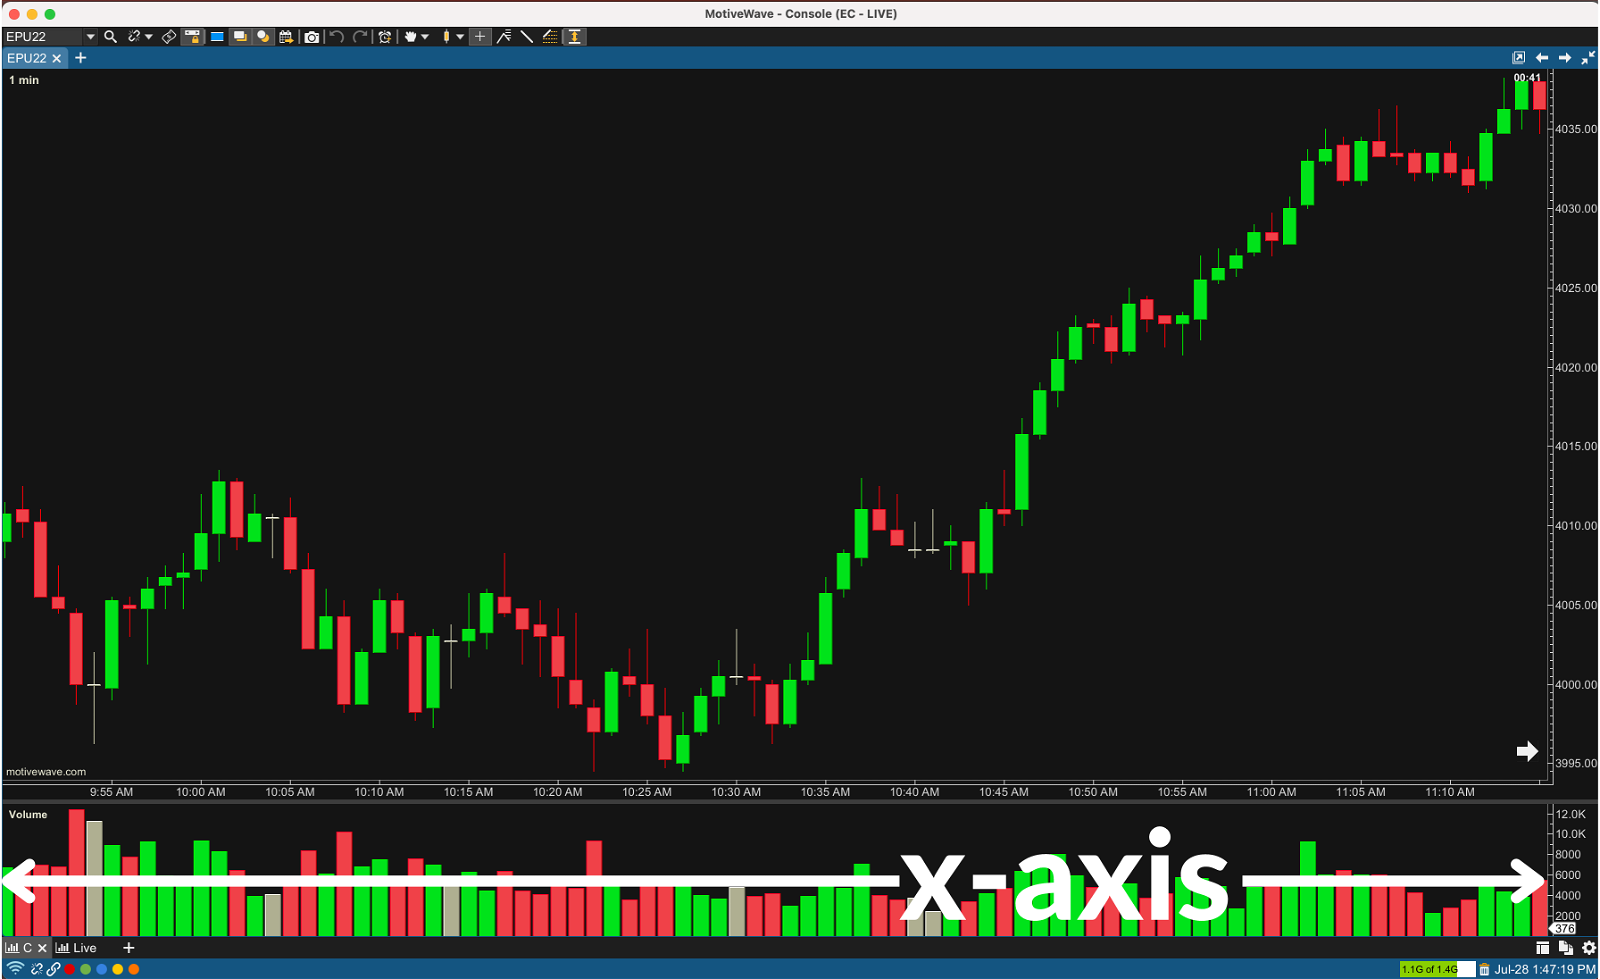
This guide is going to focus on volume profiles on the y-axis simply due to the fact it’s what most traders picture when they think of a volume profile and also what you’re probably the least familiar with.
However, a traditional volume profile like above is still a very valuable tool. If you’re not familiar with tradition volume analysis, here’s a guide.
Session Profile
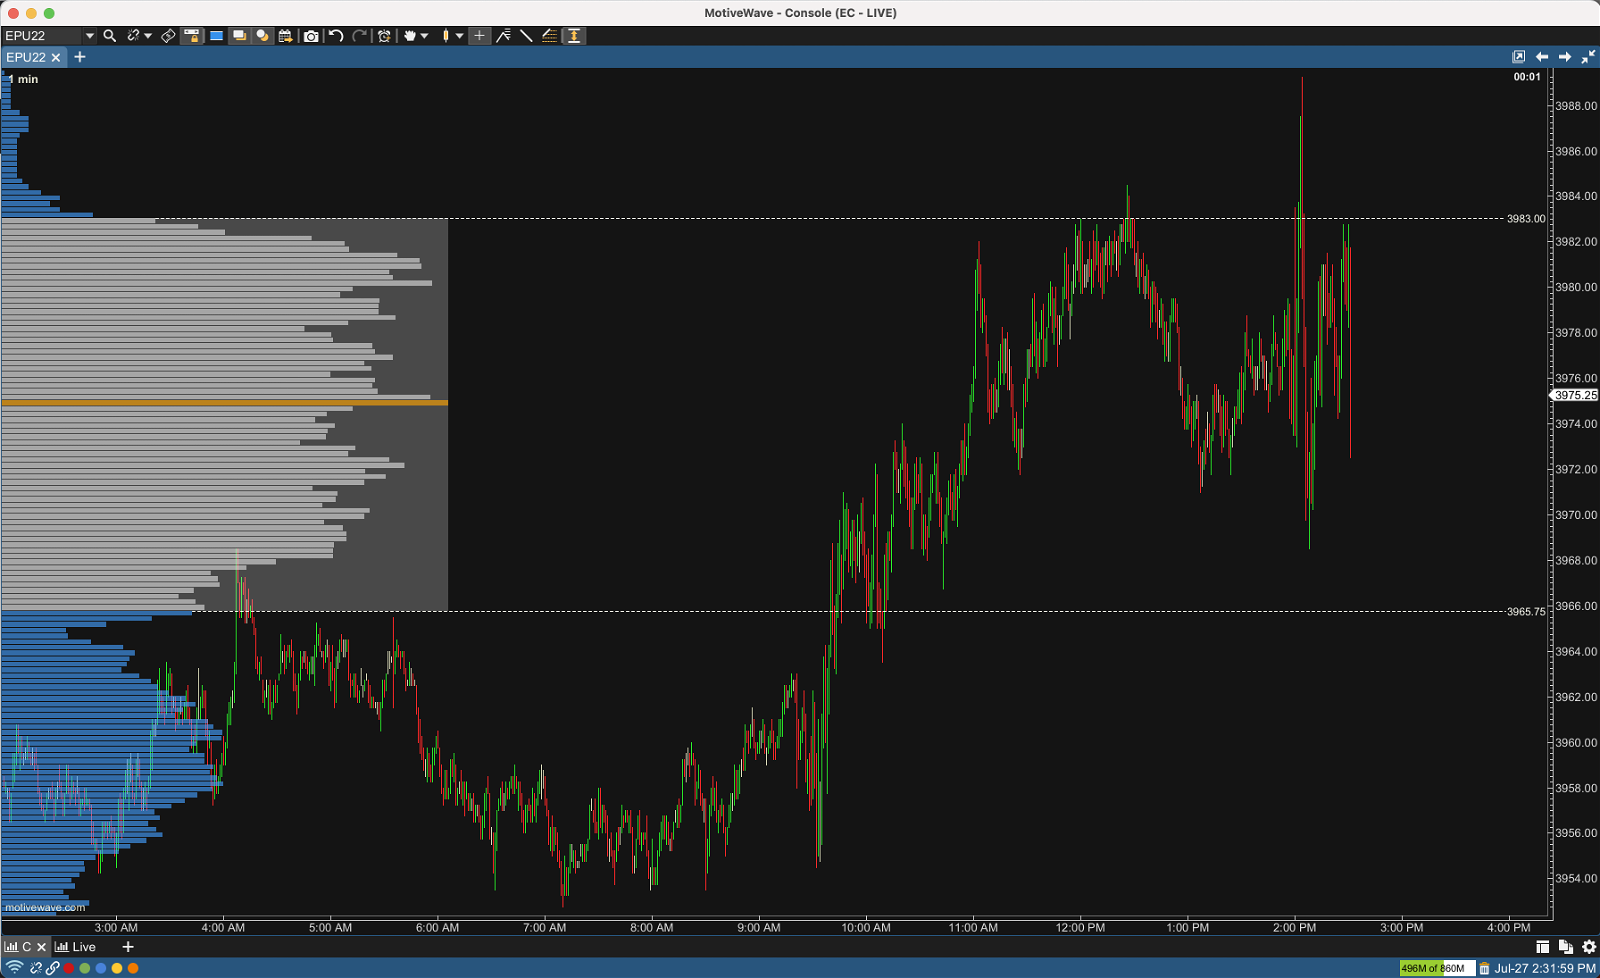
The session profile is the most common volume profile you will see. The indicator will display traded volume at every price level for a user defined session as an overlay… usually daily, weekly, or monthly.
Although this is the volume profile you have most likely seen the most often, I personally find it the least valuable due to how the session profile is typically displayed. It can be tough to analyze past profiles relative to recent profiles. That is why I prefer the candlestick volume profile.
Candlestick Volume Profile
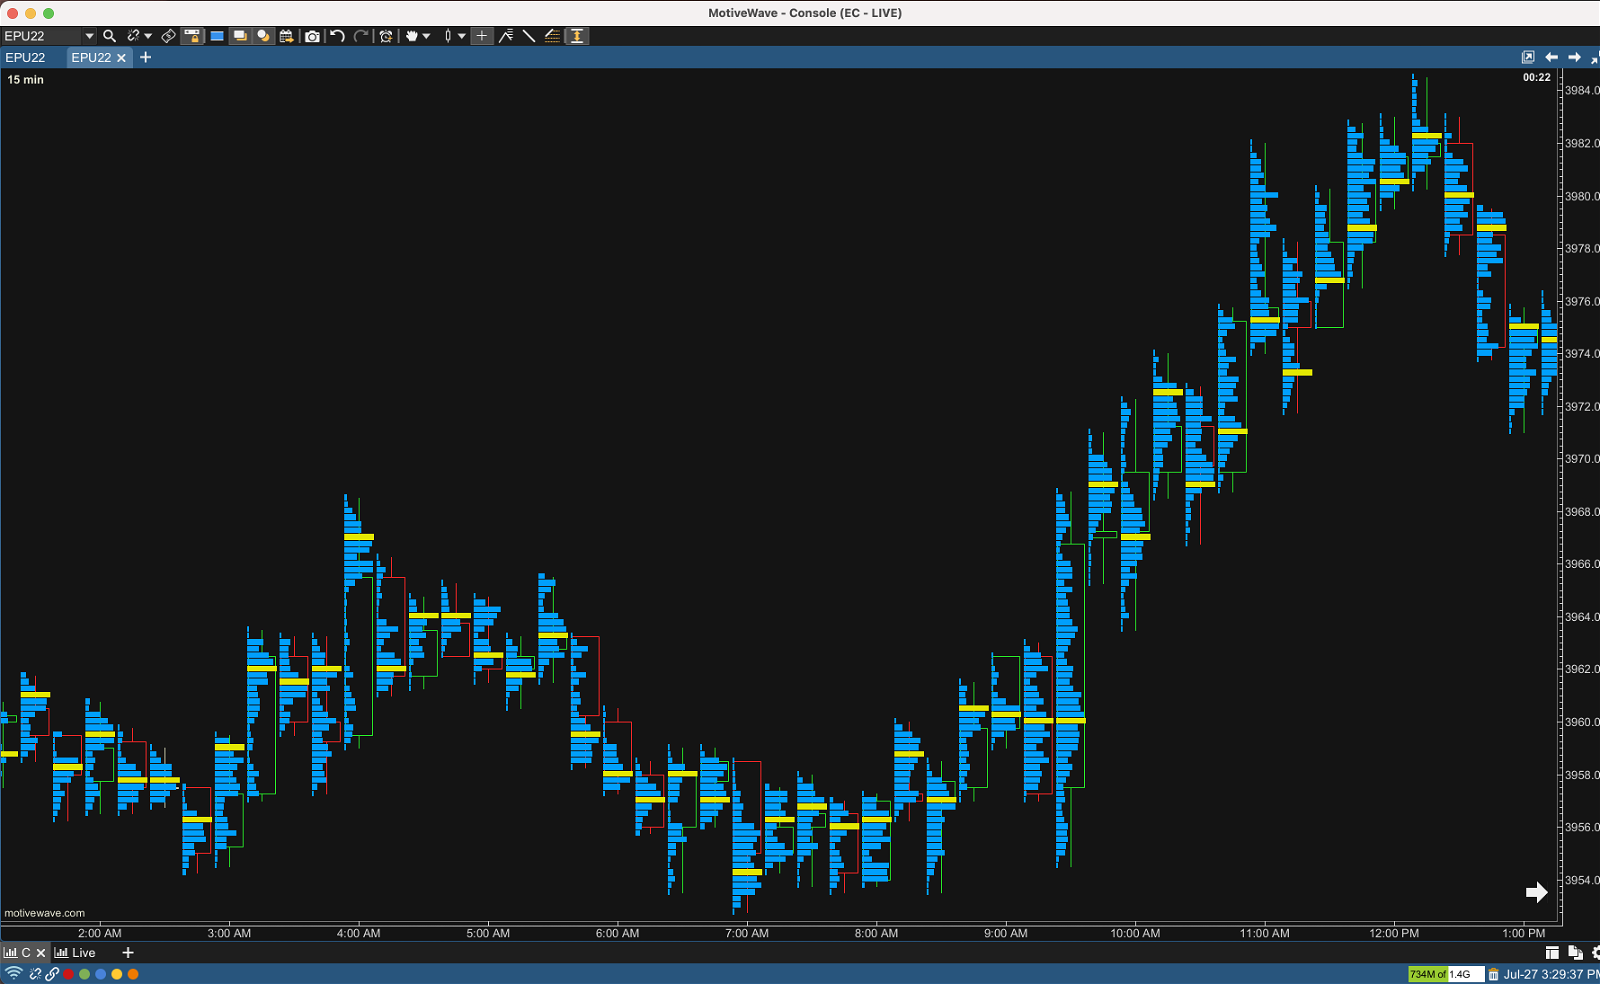
Candlestick Volume Profiles also know as volume footprints are what I personally use in all of my trading. Whether it’s my long term charts used to determine opportunity zones or my short term scalping charts, they are made up of candlestick with volume profiles.
As we begin to discuss volume profile strategies and look at at some trading setups, the power of the candlestick volume profile will become very evident.
Most charting software packages give you the option to display the candle as an out line (seen above) or as an individual candlestick to the left of the volume profile.
Now that you’re familiar with the basics, let’s look at some volume profile strategies you can use to improve your trading.
Volume Profile Strategies
As mentioned earlier, a lot of new traders are unprofitable because they fail to apply any context to their trades and are simply trading patterns.
If this is the stage you’re currently in, applying the following techniques to your current setups will result in a significant boost to your performance.
1. High Volume Node Retracements
In the above volume profile, price closed in the high volume node (value area) seen by the black candlestick.
In order for price to break away from value, either the buyers or the sellers will have to become more aggressive than the other side.
When this occurs, it leaves us with a vital piece of information. We now know who the aggressor, buyers or sellers, was at that price level. Therefore, it’s a logical place to look for a trading setup if price retraces back.
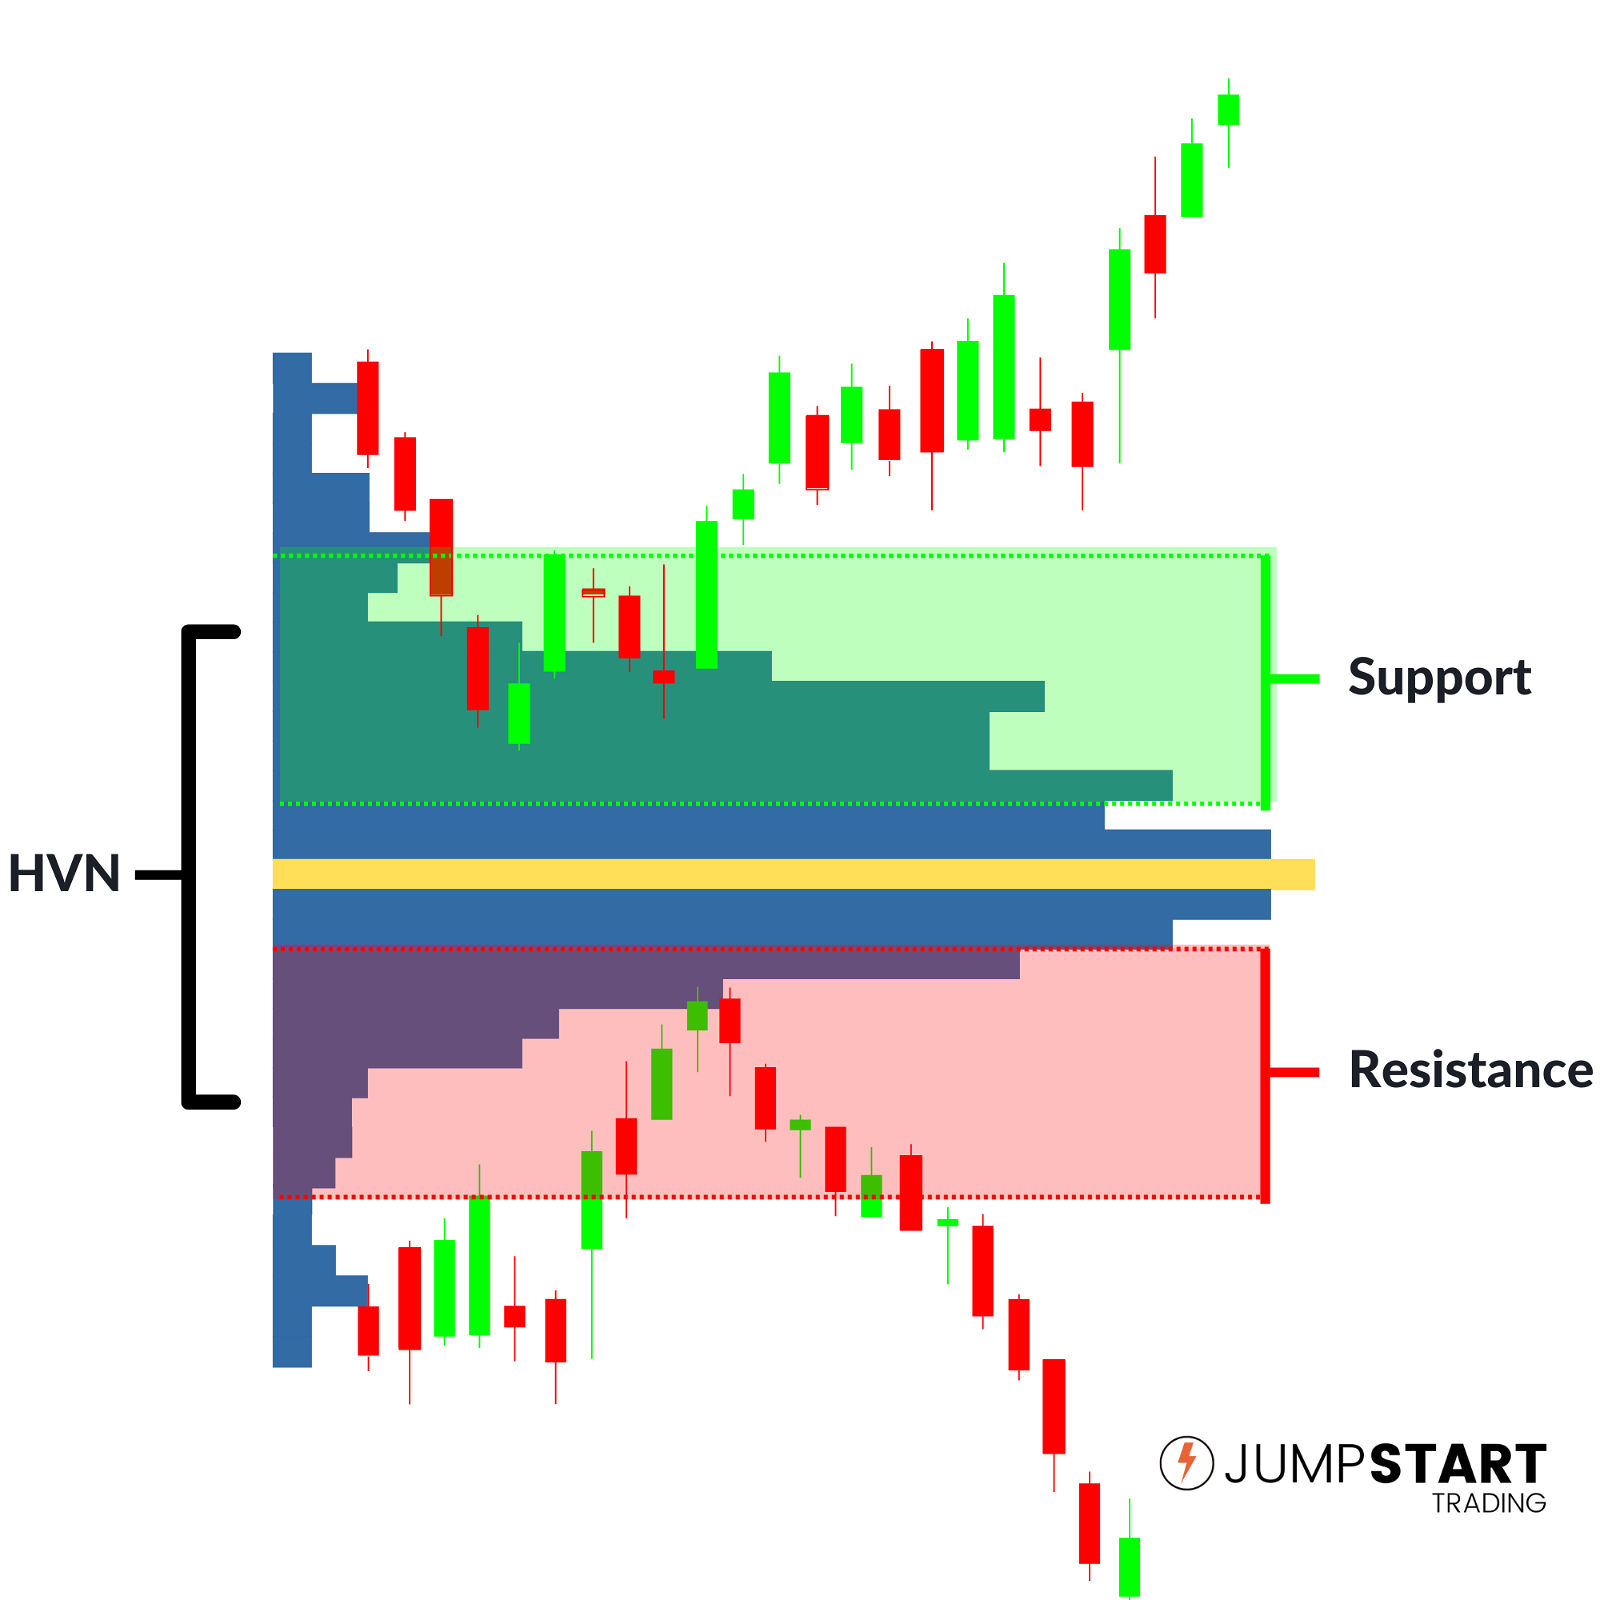
As seen in the above illustration, when price is trading below a high volume node or value area, the level will act as resistance.
When price is trading above a high volume node or value area it will act as support.
Let’s dive a little deeper and look at a real example.
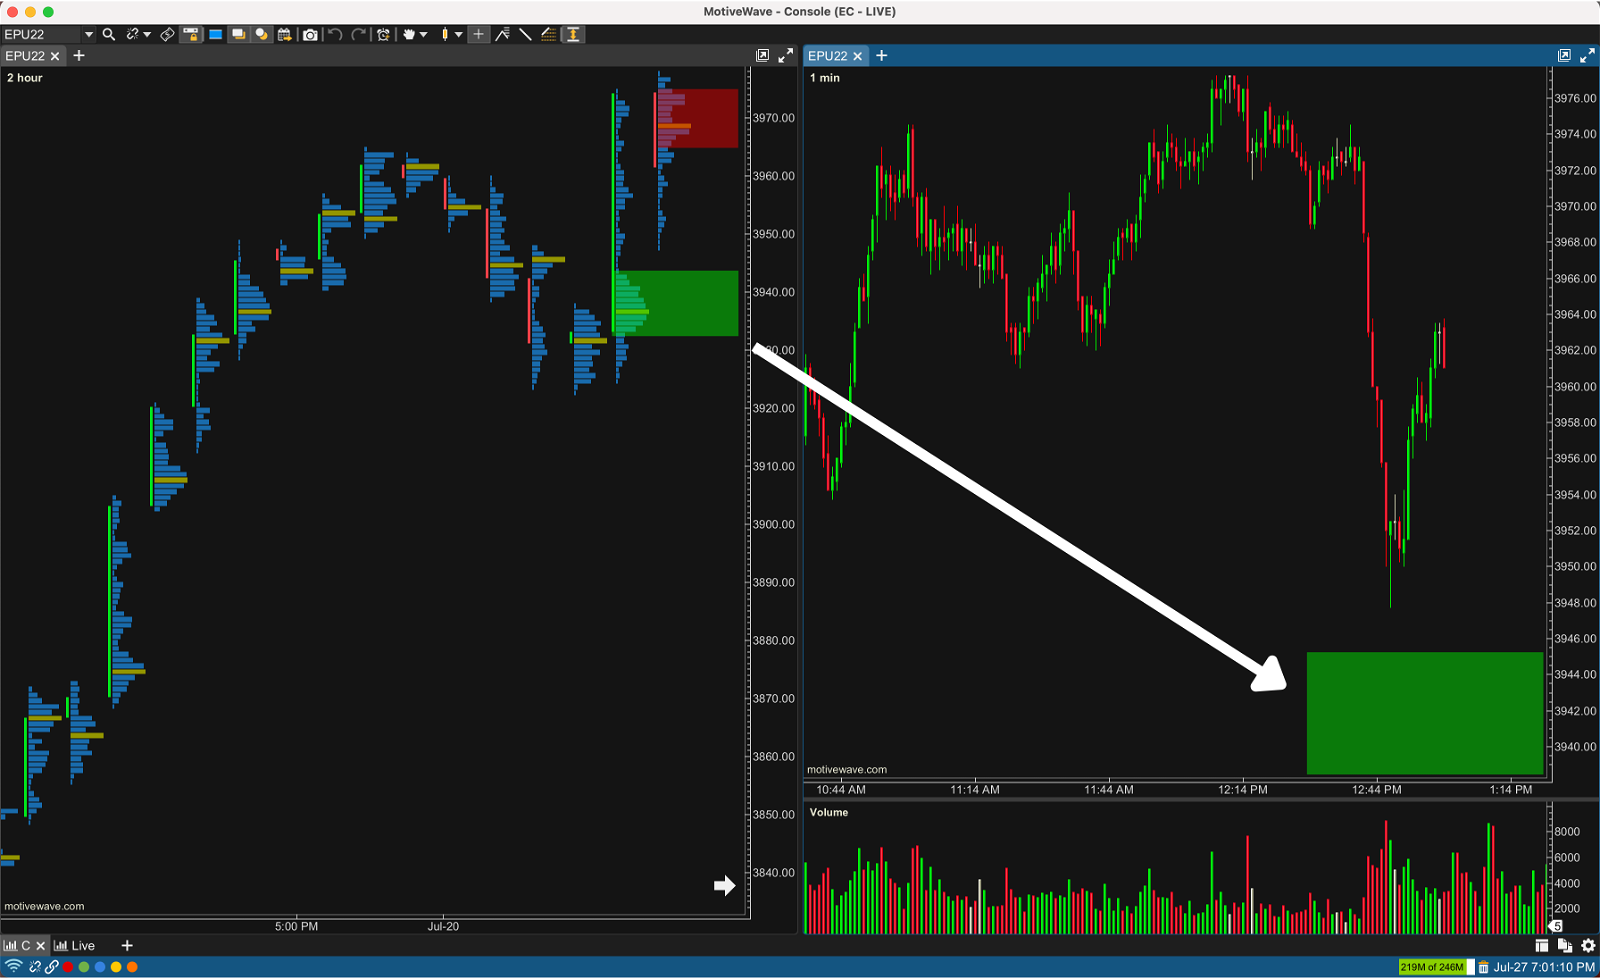
In the above eMini S&P 500 example, a 2 hour Volume Profile chart is on the left and a 1 minute chart on the right.
Overall the market had been in a very strong uptrend as seen on the 2 hour chart. If you were looking for a place to enter a long setup, the HVN of the prior bar highlighted in green is a logical place as we know the buyers dominated the sellers at those price levels recently.
I also highlighted the price area of the high volume node on the one minute chart on the right. Once price retraces back to this level you would be looking for a pattern or signal to go long.
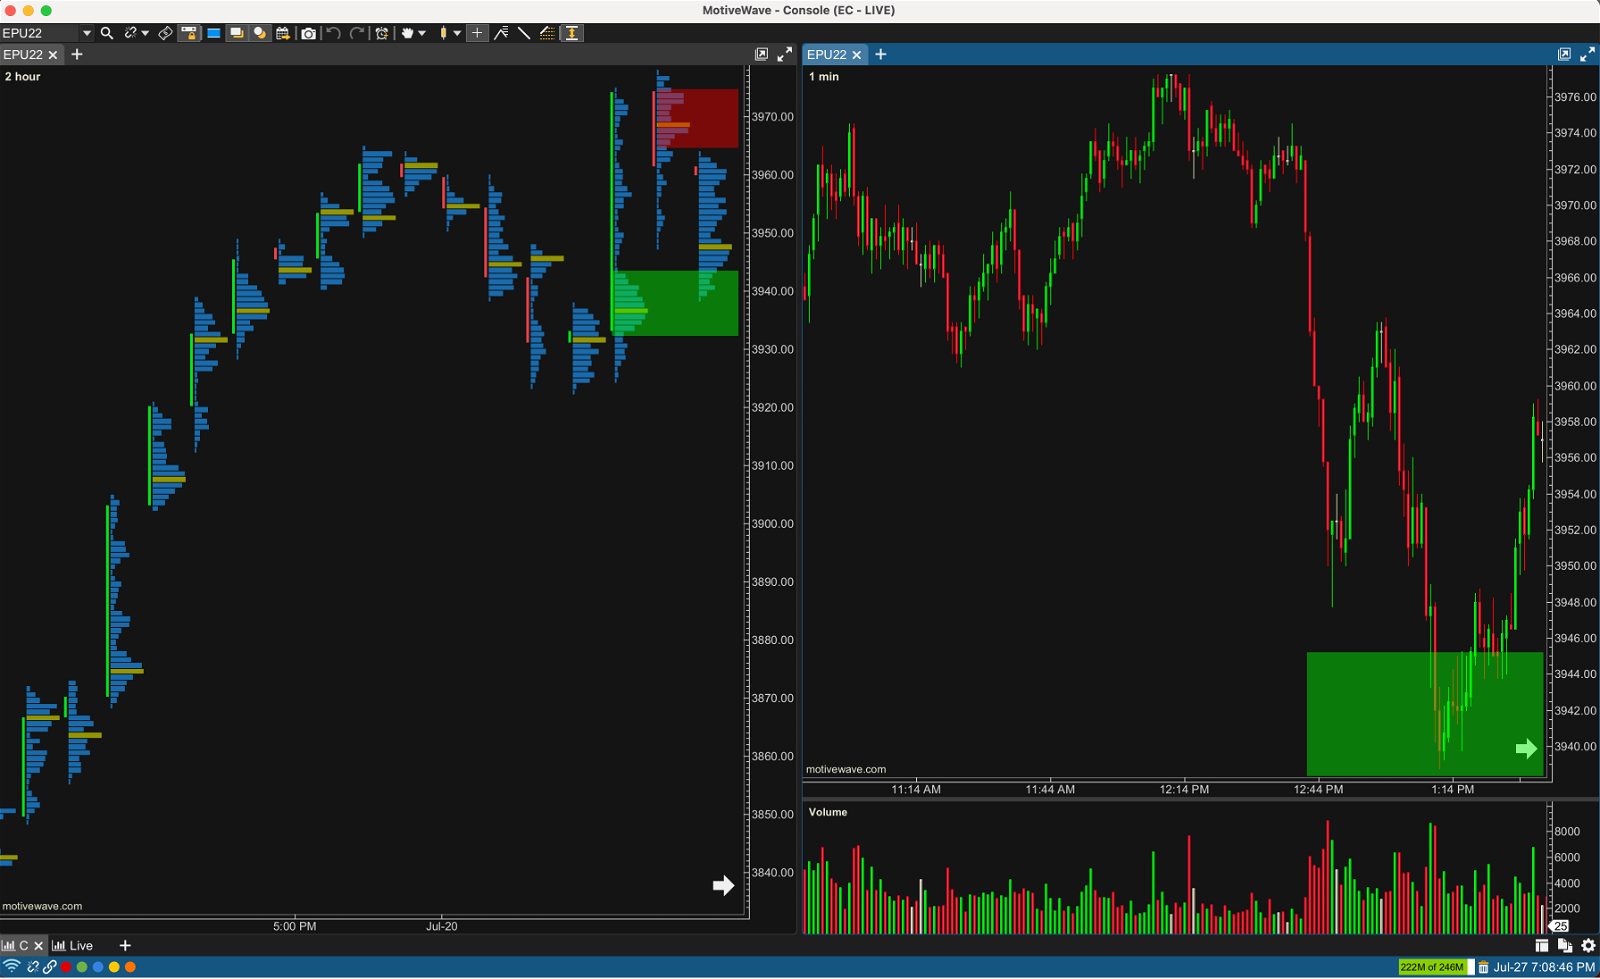
Price retraced back into the prior HVN and once again the buyer’s were the aggressor and price rallied.
A logical place to exit some of this position would have been the HVN that formed above highlighted in red as we already know sellers dominated at those price levels recently.
This obviously doesn’t mean every setup you take at a HVN will be profitable. However, as you begin to build more and more context around your trades your trade selection will improve resulting in an increased win percentage and R multiplier.
2. Low Volume Node Breakouts
Low volume nodes are zones of low liquidity where price tends to skip right over. Remember from earlier they are areas with “low gravity”.
For those of you familiar with market profiles, you can look at low volume nodes similar to single prints.
If you trade a breakout strategy, tracking past low volume nodes will help you find areas of low liquidity that can results in highly profitable trades as they rip through the LVN.
Personally I track Low Volume Nodes on a Daily Chart and project those zones on to my scalping charts. Let’s take a look at an example.
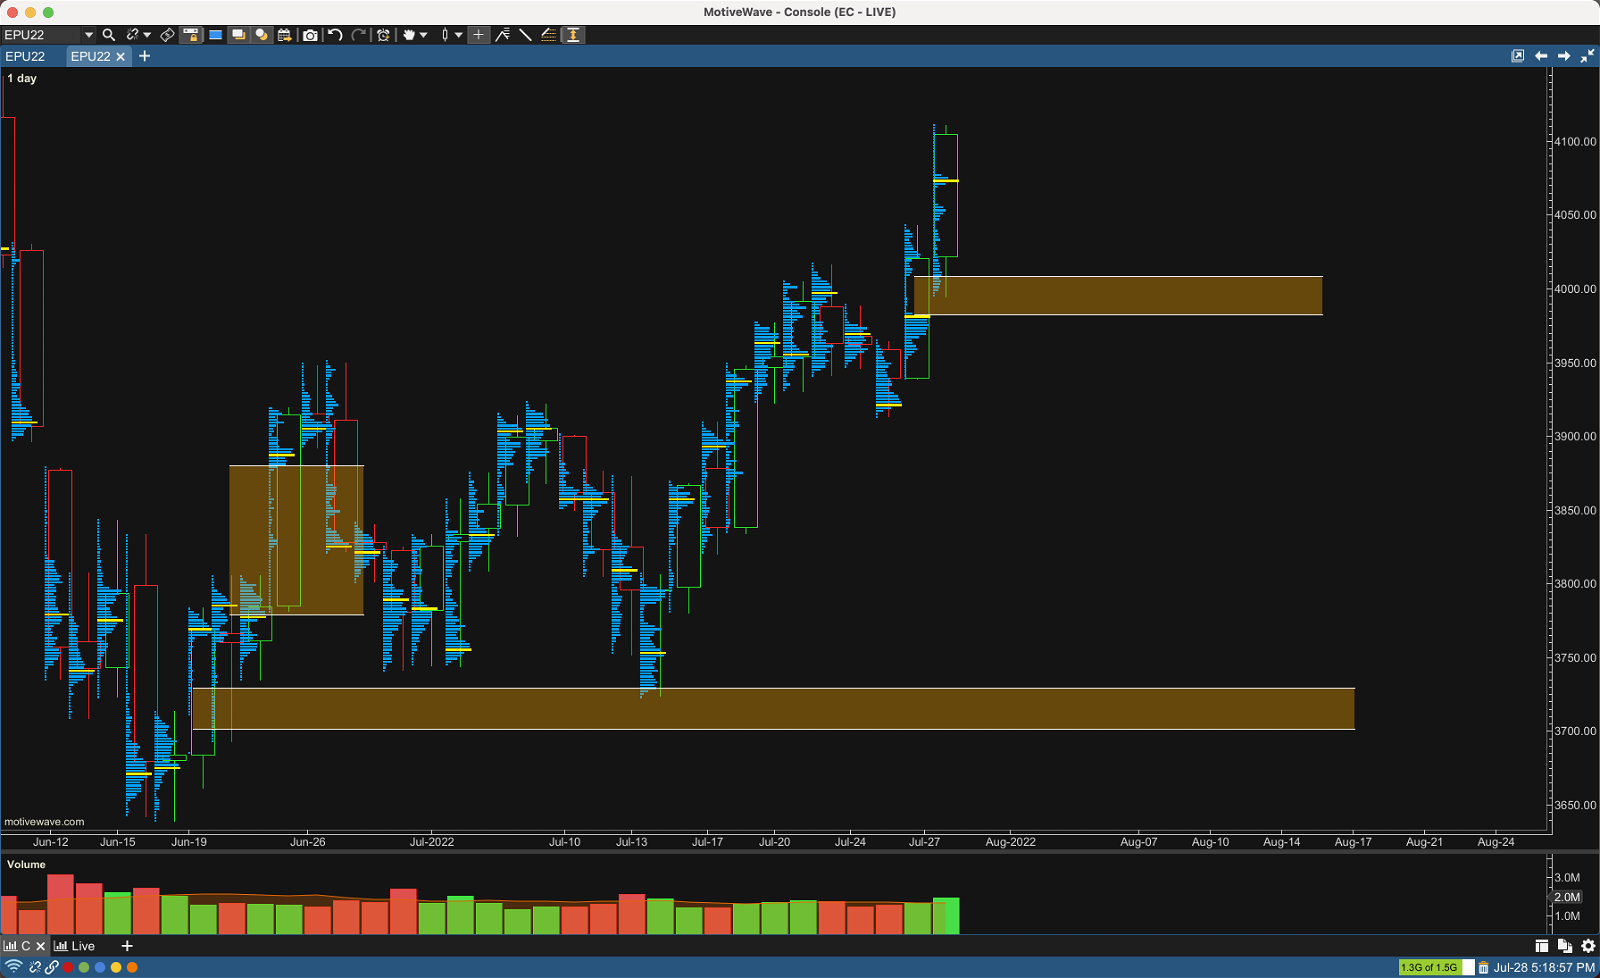
On the Low Volume Node highlighted in orange that was already intersected by price, you can see how price moved through the LVN with very little effort.
I personally don’t trade a lot of break out strategies so I tend to use longer term time frames to track LVN’s. When I take a setup that enters one of the LVN zones from my daily or weekly chart I will loosen my trade management a bit knowing the trade could run.
If you trade a lot of breakout setups you should test multiple time frames.
3. Determine Trend with Distributions
The distribution of a volume profile can help you determine the strength of a trend and spot potential reversal zones. Let’s take a look at the five different distribution types.
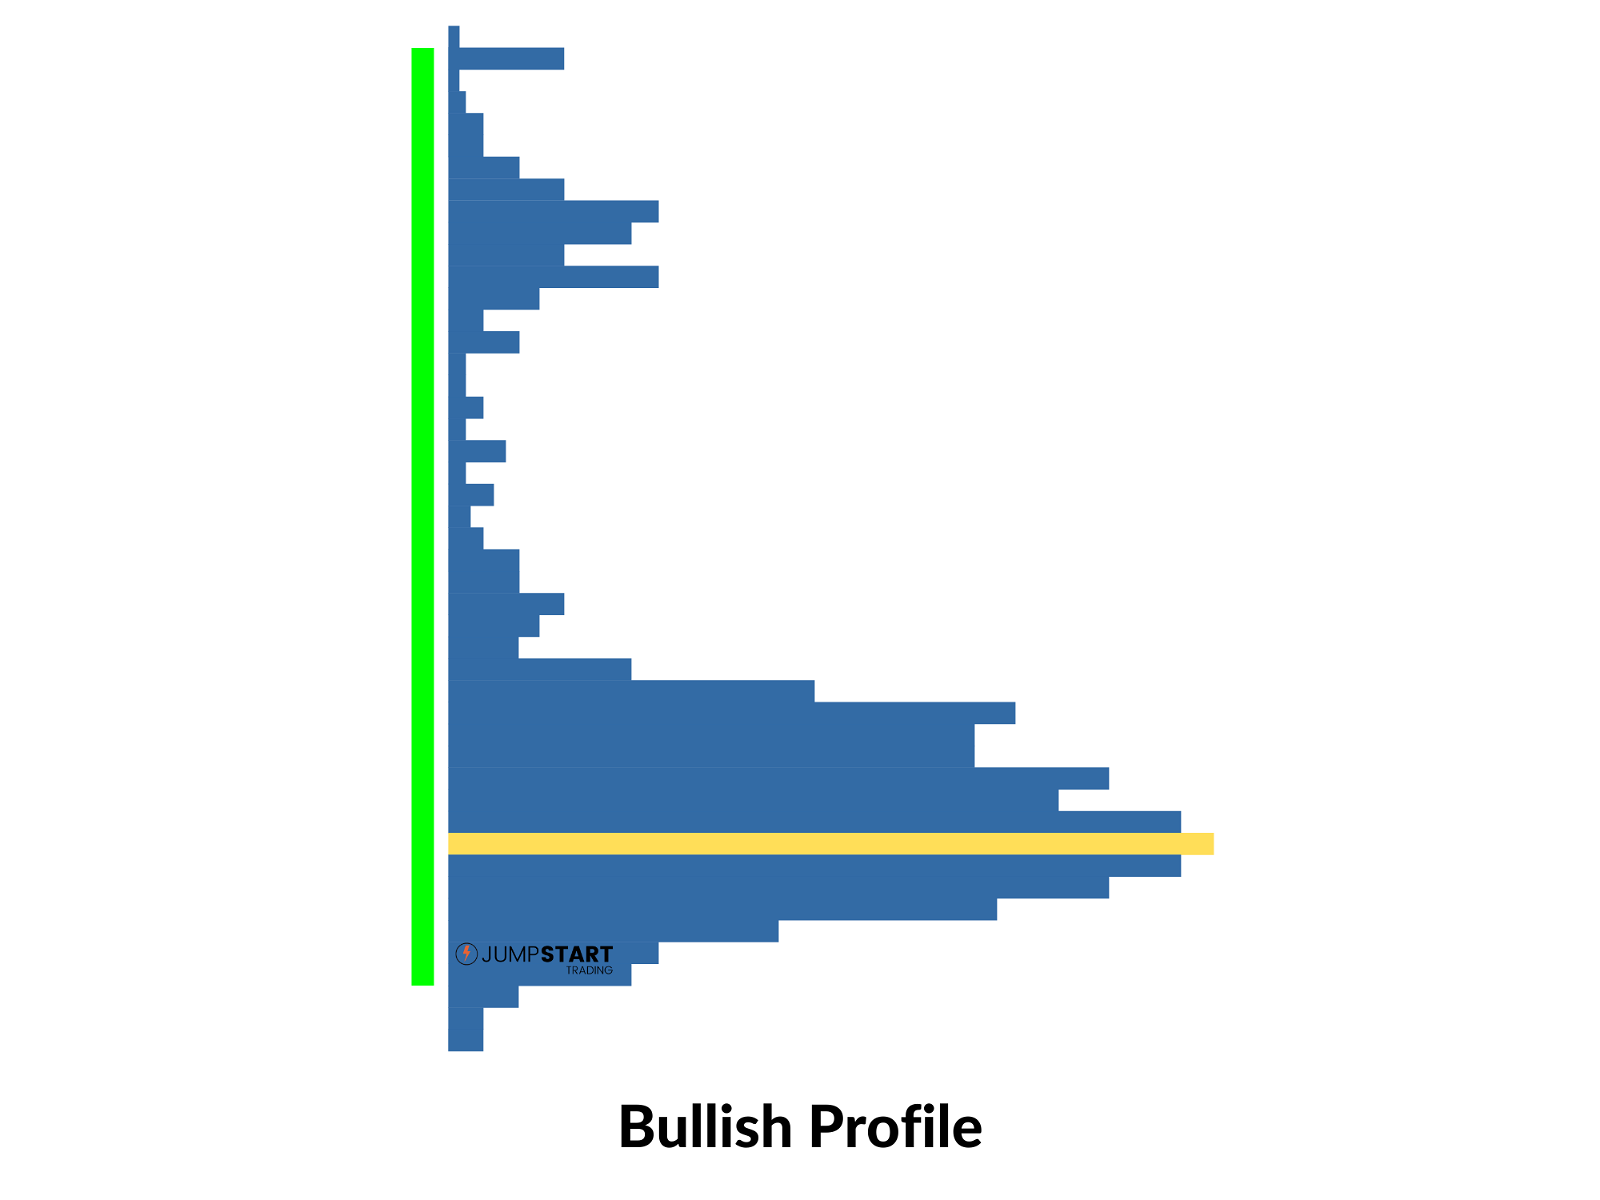
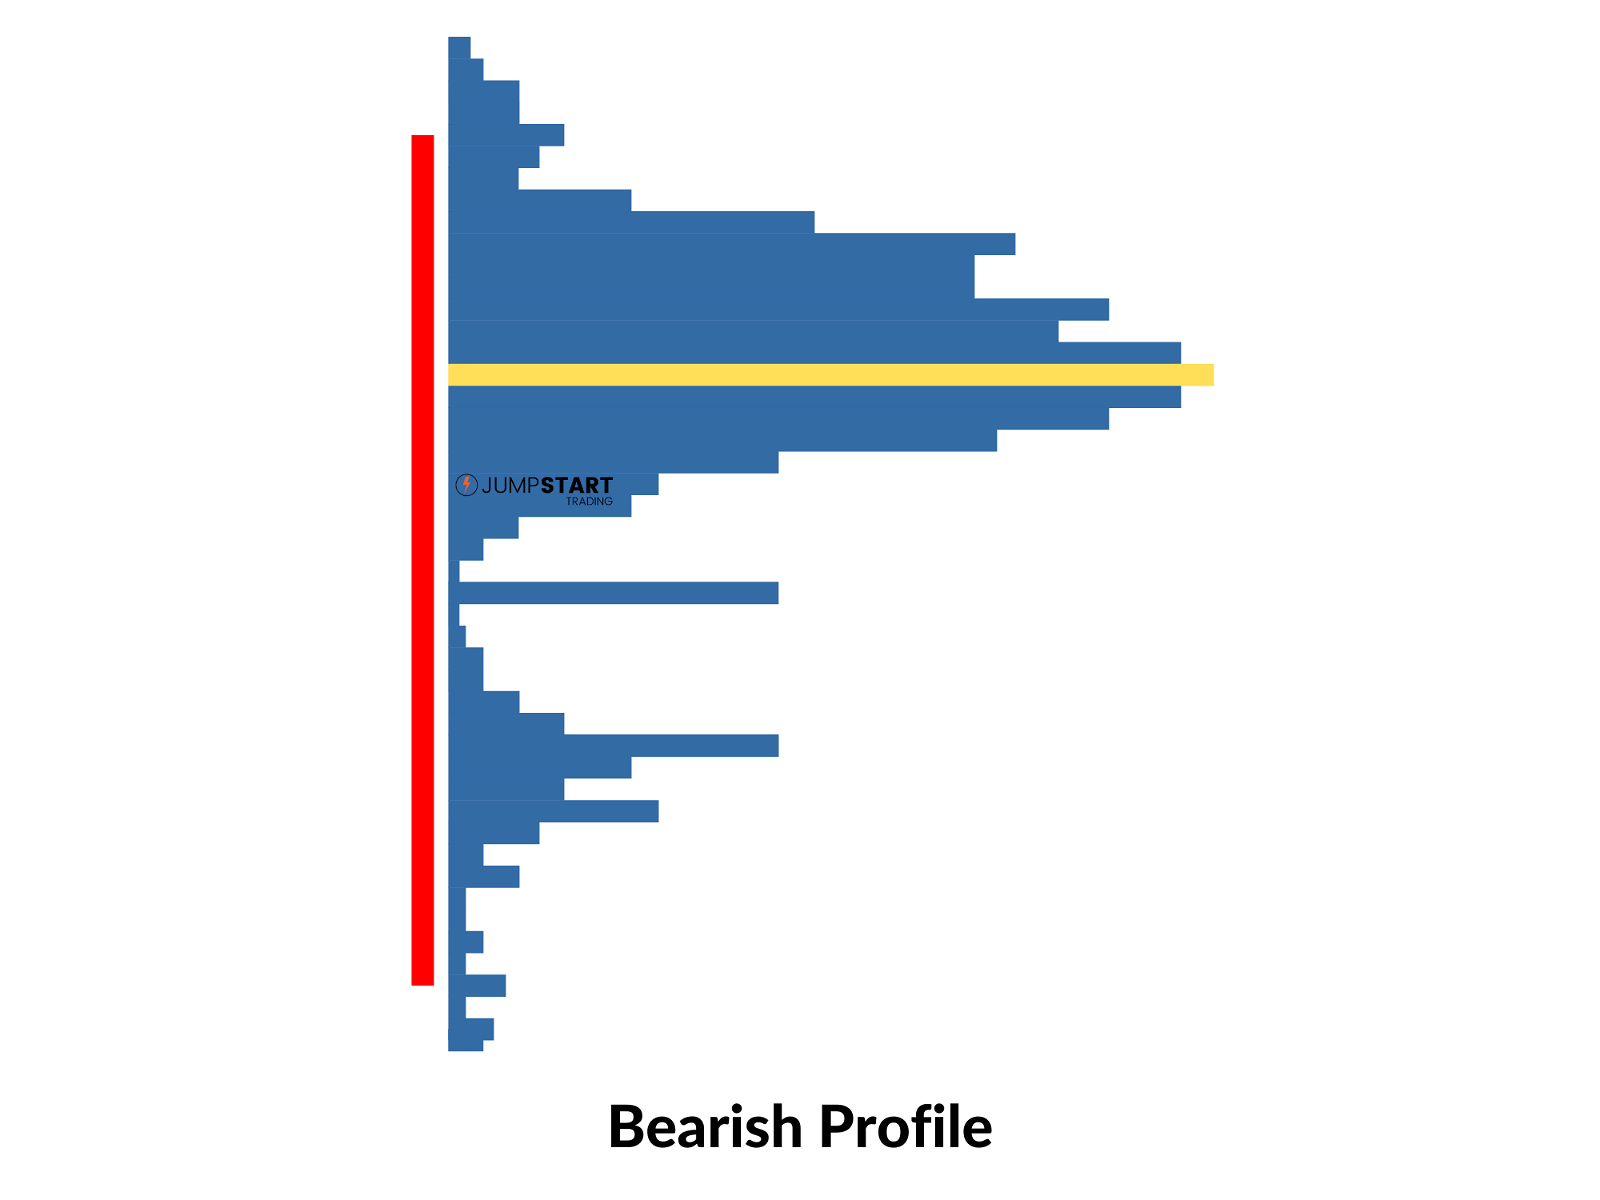
Bullish and Bearish Volume Profile Characteristics:
- Price closes near highs (bullish) or lows (bearish)
- Price is driving away from fair value
- Multiple HVN’s
- Less LVN’s
Bullish and Bearish profiles are useful to confirm trade setups as well as confirmation you should continue to hold a position you’re in.

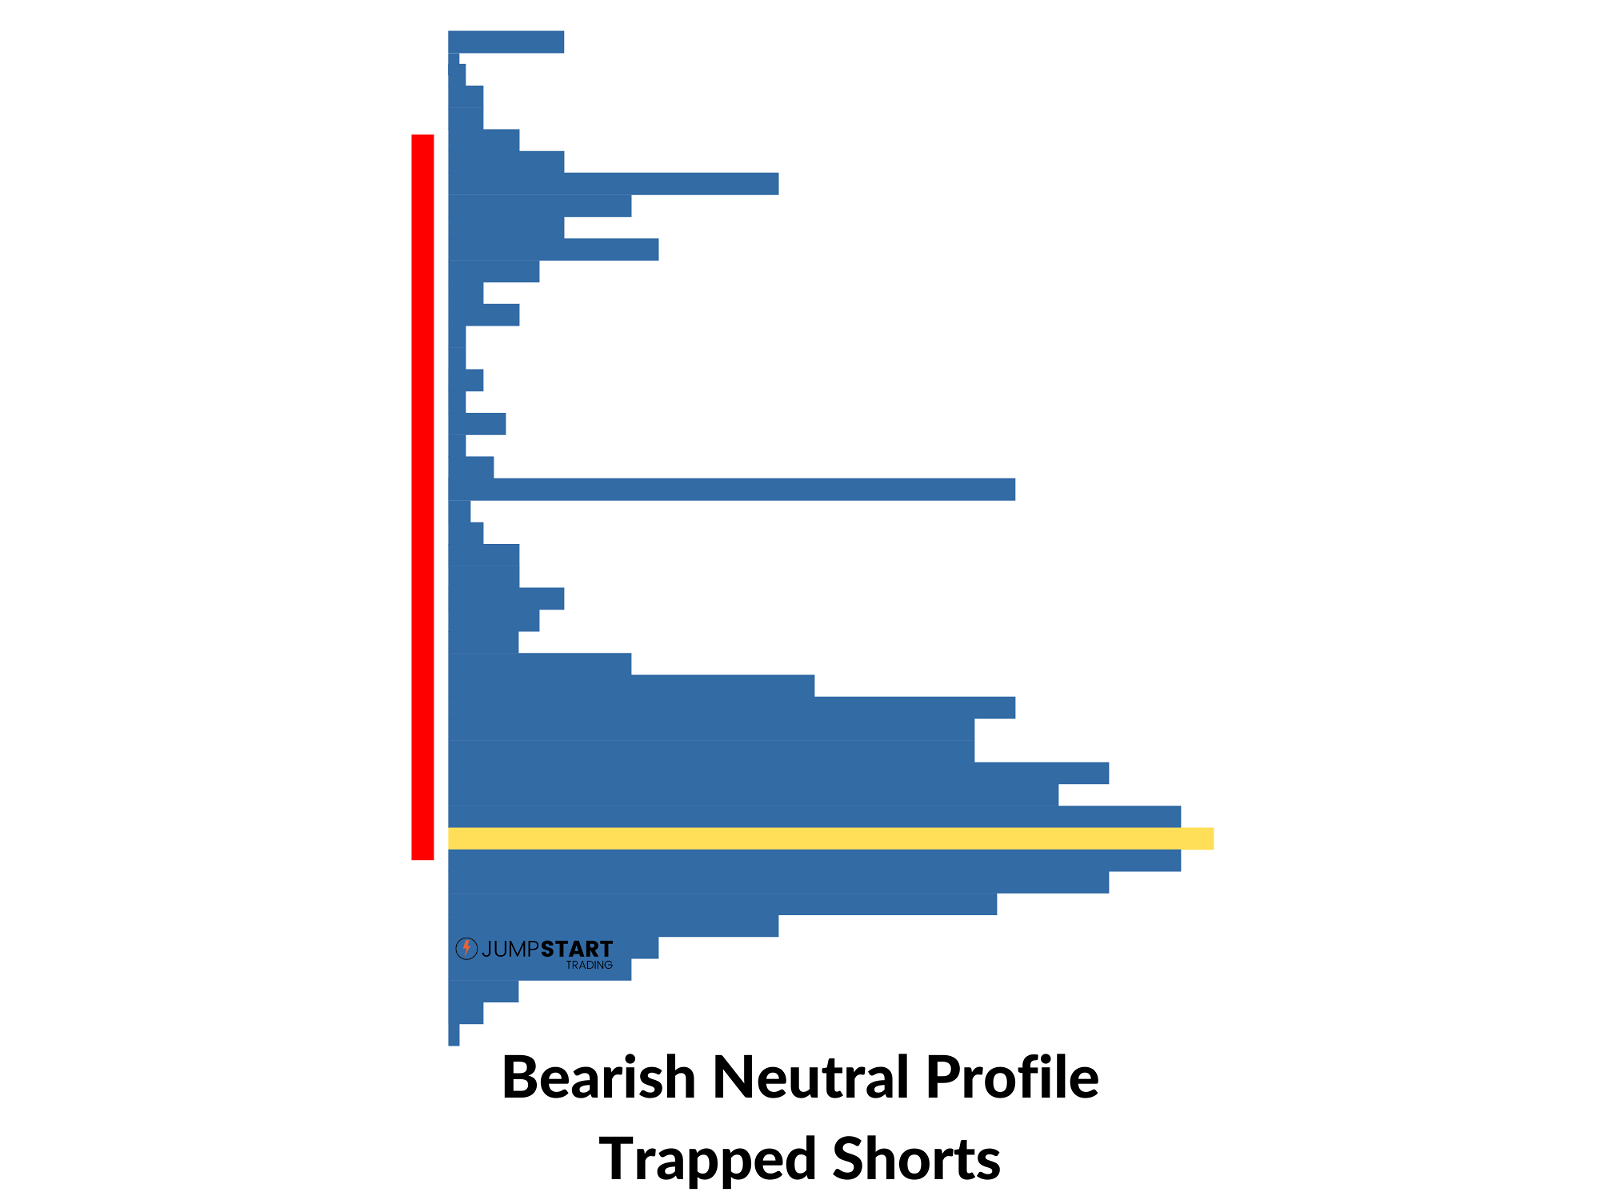
Bullish and Bearish Neutral Volume Profile Characteristics:
- Price closes near highs (bullish) or lows (bearish)
- Price closes inside or near fair value, but does not close beyond
- Trapped Traders
Bullish and Bearish neutral profiles signal a trend slowing down and a potential reversal. You will commonly hear traders say there’s “Trapped Traders” when a neutral profile forms.
The term trapped traders comes from the fact that either buyers are long at an extreme of a session (bullish neutral profile) or short from an extreme (bearish neutral profile).
You can use neutral profiles as a sign to take off some of your position or for a potential reversal setup.
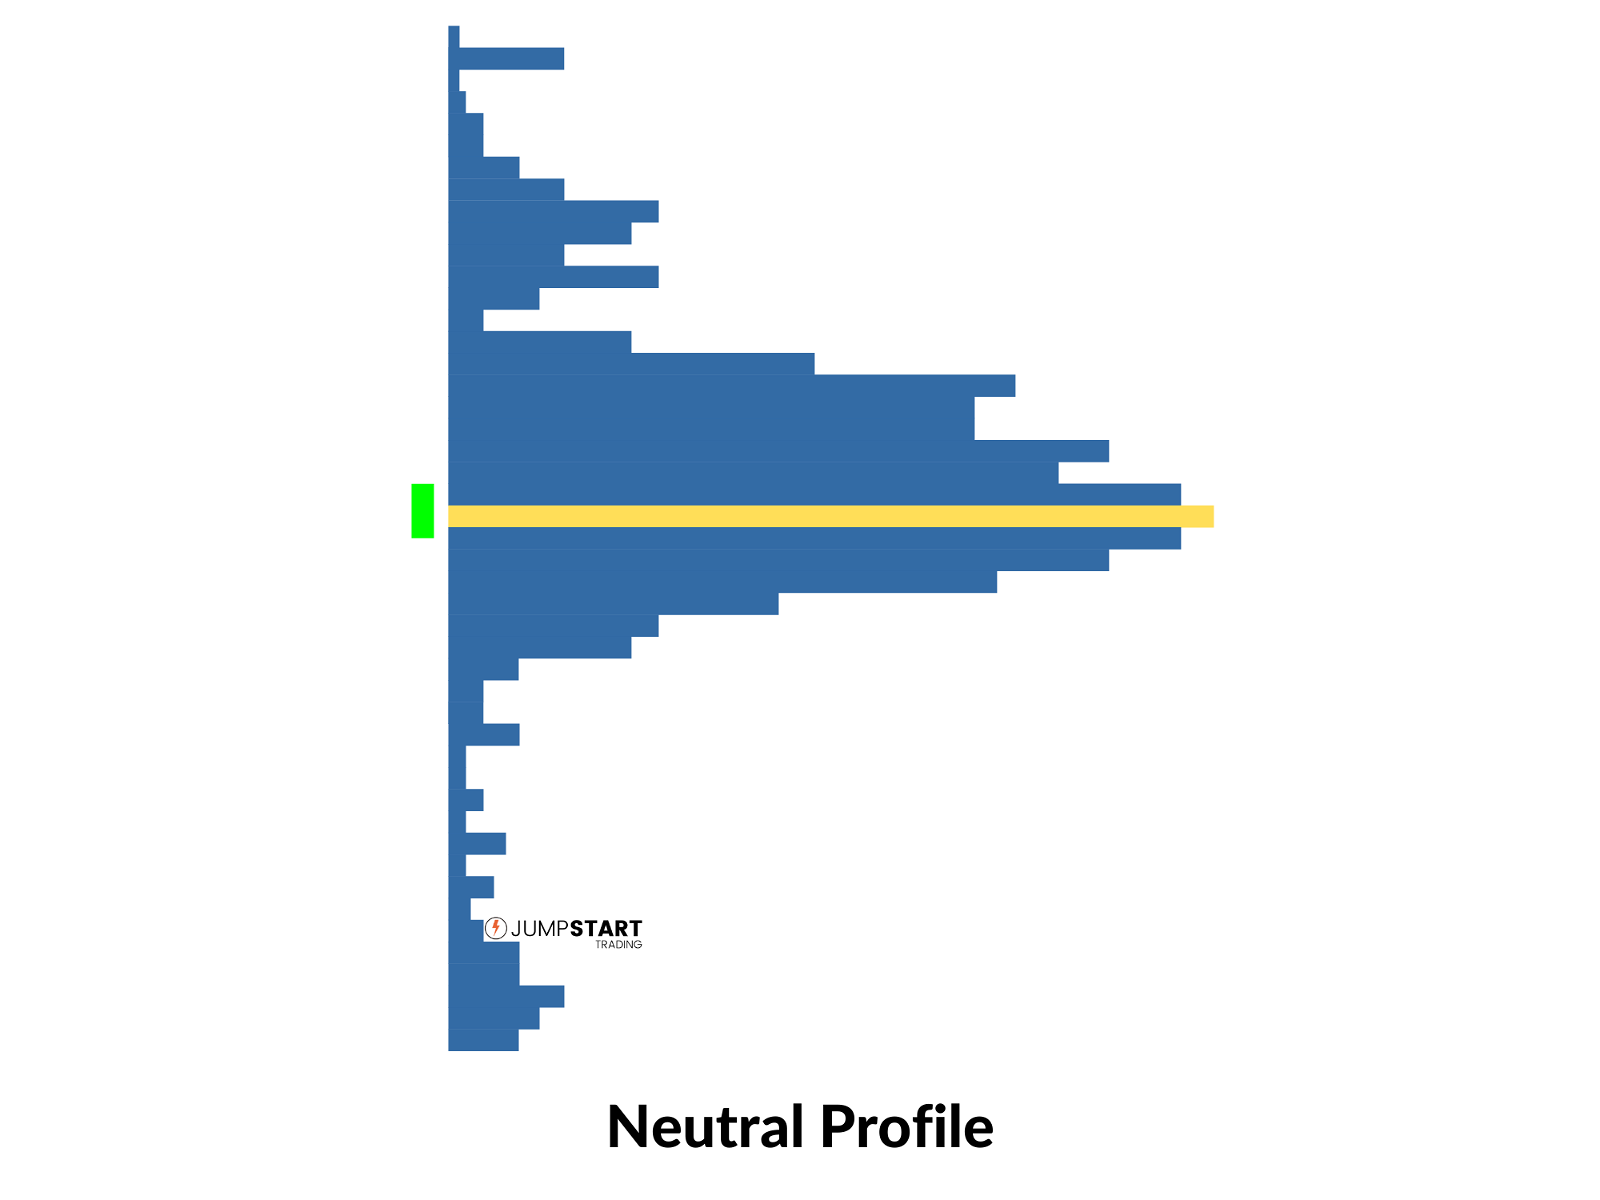
Neutral volume profiles are characterized by a value area near the middle of the profile and price closes inside the value area. Out of all the distribution types, a neutral profile comes closest to a normal distribution.
Neutral profiles occur as a result of balance in the market. Use neutral profiles to trade ranges or as an indicator to stay out of the market until a new trend forms.
4. Key Support & Resistance Levels
Volume profiles make it very easy to identify key support and resistance levels from long term charts. Every morning before the open I update my Daily and Weekly chart looking for new high volume nodes. (similar to LVN’s discussed above)
On my daily chart I look for stacked points of control and on my weekly charts I project any POC’s forward that haven’t been intersected.
Notice how price reacted when it intersected some of the stacked POC’s on the the daily chart above.
These tend to be very strong support and resistance levels that can result in explosive reversals.
This doesn’t mean I just go blindly long or short when price retraces back to one of these levels. It’s beneficial to think of them as opportunity zones where you will look for a setup.
Copying these levels onto the charts you use for your entries will help boost your R multiple.
5. Stop Loss Management
Similar to the classic strategy of trailing candlesticks that close at new highs or lows, you can trail your stop behind Point’s of Control as seen in the example below.
In doing so your systematically trailing your stop behind a logical level with data to back it up rather than some random price point.
You’re also reducing your risk by locking in more profit faster than most traditional trailing methods as seen in the example.
6. Improve R Multiple
R is the initial risk you take on a given trade, defined by your stop loss. As traders, we define our profits in Multiples of R.
For example, if your initial risk on a trade $100 and you profit $300 your R Multiple would be $300 (Profit) ÷ $100 (Initial Risk) = 3R.
So how can volume profiles help improve your R Multiple? It all starts before the trade happens. We can use HVN’s and value areas to estimate R for a given trade.
In the above example I’ve highlighted the current bars value area in green since we’re trading inside of it and the prior bars value in red (resistance) since we’re trading below it.
Knowing that price often will move through low volume nodes with ease the HVN that formed above on the prior bar is a logical place to look to exit the trade.
When determining whether to take this setup you can calculate the R Multiple and if it fits with in your strategies parameters you take the trade otherwise pass.
The R Multiple when evaluating this trade would have been:
25 (Profit) ÷ 8 (Risk) = 3.1R
As can be seen above, this trade could have resulted in 3R or greater depending on the exit strategy you used.
In the example below you can see our initial R Calculation is much lower.
4 (Profit) ÷ 3 (Risk) = 1.3R
You can see price rallied to the value area and struggled. Although this setup eventually rallied, odds are you would have been stopped out.
Using context to improve your trade selection is key. You now have the ability to build some context around your trades to build a better estimate of your potential R multiple.
Determining Volume Profile Time Frames
Determining what time frames you primarily focus on will be determined by your style of trading and will take some experimenting. Here’s some loose suggestions to get you started.
8 Hour, Daily, & Weekly Volume Profiles
No matter what style of trader you are, you can use daily and weekly volume profiles to label key support and resistance levels.
The 8 Hour profile is great to look at before the market opens to view overnight activity which can indicate the direction the market will open.
5, 15, 30, 60, 120 Minute Profiles
The majority of day traders will use these time frames to build intraday support and resistance levels.
If your average hold time of a position is less than 5 minutes I would focus on 5, 15, and 30 minute profiles.
If your average hold time is over 5 minutes I would focus on 30, 60, and 120 minute profiles.
Again, these are just some suggestions to get you started. You should experiment with multiple time frames. Constantly testing and looking to better define your trading edge is key for longterm success in this business.